

| TL;DR Most teams pick a model off a leaderboard and overpay for intelligence they never use. LLM benchmarks start earning their keep only after you translate each score into three things: a task match, a saturation check, and a cost per solved problem. This guide hands you that translation layer. Five benchmark families, the budget call each one supports, and the trap hiding inside every number. |
| LLM benchmarks are standardized tests that score language models on tasks like reasoning, coding, and tool use. A score matters only when you map it to a real workload. Match the benchmark family to your task, check the score for saturation, then compare models on cost per successfully completed task, not raw accuracy. |
Picture a procurement call. A leaderboard sits open on one screen and a pricing page on the other. The top model wins the contract because it scores 2 points higher on a famous test. Six months later an engineer runs the same workload through a model that costs a third as much. It clears the quality bar on the first pass. Nobody opens that leaderboard again.
This story repeats across the industry for one reason. Scores are everywhere. Translation is nowhere. A leaderboard tells you who won. It never tells you what a point is worth in money. And the numbers themselves are aging fast. The Stanford AI Index reported in 2026 that nearly half of the 60 most cited benchmarks are saturated, so many famous scores no longer separate the models you are actually choosing between.
The skill worth learning is not memorizing scores. It is reading any ai llm benchmark table and walking away with a budget decision. That skill takes about ten minutes to pick up. Here it is.
Why a High Benchmark Score Can Still Waste Your Money
Three problems hide inside almost every public number.
The single number problem comes first. One accuracy figure compresses thousands of test items into a lonely percentage. A model can post 84 percent overall while acing short inputs and falling apart on the long documents your team feeds it daily. The average looks fine. Your experience does not.
Benchmark saturation comes second. A test stops being useful once every frontier model clusters near the top. When five models sit within 2 points of each other, the ranking measures noise, not capability. You end up paying a premium for a rank that a coin flip could reproduce.
Benchmark contamination comes third, and it is the sneaky one. Public test questions leak into training data because labs scrape the open web. A model that memorized the answer key looks brilliant on the test and ordinary on your work. One published review of a famous knowledge test even found that roughly 6.5 percent of its questions carry wrong answer keys, so a portion of every score on it measures agreement with errors.
Run a three second sanity check before trusting any score:
- Spread: are the top models separated by more than 3 points? If not, treat them as tied.
- Age: has the test been public for years? Assume some contamination.
- Match: does the tested task resemble your production task? If not, the number is trivia.
How to Read an AI LLM Benchmark Like a Buyer, Not a Fan
Fans read leaderboards top to bottom. Buyers read them sideways. Here is the five step translation, and yes, it works on every ai llm benchmark you will ever meet.
- Name the workload first. Write down your top three production tasks before you open a single leaderboard. Scores only mean something relative to a job.
- Match task to benchmark family. Every score outside your family is entertainment. The next section maps the five families to decisions.
- Check the spread. If the top five models sit within 2 points, let price decide. A tie in capability is a win for your budget.
- Convert to cost per solved task. Success rate divided into your per attempt cost beats raw accuracy every time. The formula sits a few sections down.
- Verify on your own data. Twenty real examples from your workload predict your outcome better than any public number. This is the step almost everyone skips.
The Five Benchmark Families and the Budget Call Each One Supports
Every public test falls into one of five families. Each family answers one business question and hides one trap. Read your model evaluation through this lens and the noise drops away.
1. Knowledge and reasoning tests
What the number says: broad academic competence across subjects, the closest thing to a general IQ score for models.
What it hides: this is the most saturated family. Frontier models cluster above 90 percent on the classic tests, so top end differences are noise. Newer expert built exams push back. Humanity’s Last Exam drew 2,500 questions from about 1,000 subject experts, and frontier leaders still score near 45 percent while human specialists reach about 90. That gap is real signal.
The budget call: for general chat, drafting, and summarization, a mid tier model is the rational purchase. Reserve premium spend for tasks where the newer expert exams still show separation.
2. Coding benchmarks
What the number says: the share of real software tasks a model completes, verified by running the code. Execution based tests such as SWE-bench Verified are the hardest family to fake because the patch either passes the test suite or it fails.
What it hides: coding scores move fast. The top verified score jumped roughly 15 points in a single year. A ranking from two quarters ago is a museum piece.
The budget call: for high volume dev work, weigh the score against per token price. A model 4 points behind at half the cost usually wins once you do the division.
3. Agentic and tool use benchmarks
What the number says: how often a model completes multi step tasks with tools, browsers, or terminals. Agentic benchmarks map directly to automation value because a completed task equals work a person did not do.
What it hides: completion rates fall sharply as tasks get longer. A model that clears 80 percent of five step tasks can clear far less of twenty step tasks, and error compounding does the damage quietly.
The budget call: measure against headcount math. If an agent completes 70 percent of a workflow reliably, price the remaining 30 percent of human review into the comparison before you commit.
4. Long context benchmarks
What the number says: how well a model finds and uses information buried deep in large inputs.
What it hides: the classic budget trap. Teams pay premium rates for million token context windows while their median document runs twelve pages. You are buying warehouse space to store a bicycle.
The budget call: pull the real length distribution of your inputs first. Pay for the context your documents reach, not the context the demo video showed.
5. Human preference arenas
What the number says: which model people liked more in blind votes, expressed as an Elo style rating on the public llm leaderboard sites.
What it hides: votes reward confidence and pleasant style, not correctness. A model can charm its way up an arena while losing to a rival on verifiable tasks.
The budget call: use arenas as a tiebreaker for customer facing tone. Never use them as a primary purchasing criterion. Your finance team deserves better evidence than vibes.

LLM Benchmarks vs Business Decisions: The Translation Table
Keep this table next to any leaderboard. It converts llm benchmarks into the one decision each family supports. The private option sits first because it is the only test no vendor can game.
| Test type | Question it answers | Budget decision it supports | Trap to avoid |
| Private eval (Humyn Labs) | How does the model perform on my exact tasks? | Final model selection and renewal decisions | None from contamination, it never enters training data |
| Knowledge and reasoning | Is the model generally capable? | Tier selection: premium, mid, or budget | Saturation makes top ranks meaningless |
| Coding | Can it complete verified software tasks? | Per seat and per token dev spend | Stale scores in a fast moving family |
| Agentic and tool use | Can it finish multi step work alone? | Automation and headcount planning | Completion collapses on long task chains |
| Long context | Can it use large inputs well? | Paying for context window size | Buying length your documents never reach |
| Preference arenas | Do people like its answers? | Tone tiebreaker for customer facing use | Style votes mistaken for accuracy |
From Score to Spend: Calculate Cost per Solved Task
Here is where the translation becomes money. API prices fell about 80 percent between 2025 and 2026, and output tokens still cost several times more than input tokens, so the price side of this math moves in your favor if you actually do it.
The formula is short. Cost per solved task equals your cost per attempt divided by the success rate from your benchmark family.
- Pull your monthly task volume and estimate output tokens per task. Say 2,000 tokens.
- Multiply by the model price. Model A at 8 dollars per million output tokens costs 1.6 cents per attempt. Model B at 2 dollars costs 0.4 cents.
- Divide each by its success rate on your family. Model A at 90 percent lands at 1.8 cents per solved task. Model B at 84 percent lands at 0.5 cents.
- Compare. Model B delivers a solved task at roughly a quarter of the price while giving up 6 points of accuracy. If your quality bar sits at 84, Model B wins and the leaderboard loses.
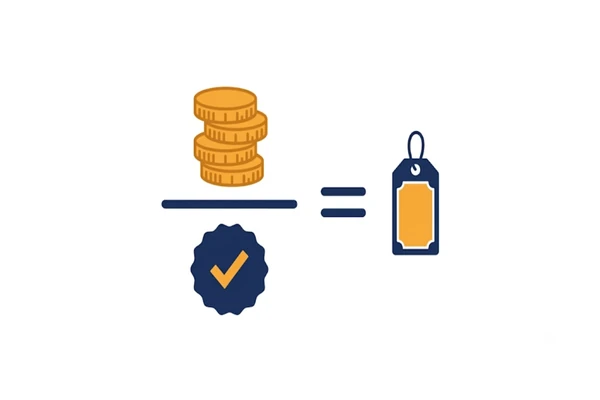
And that is the whole trick. The cheapest model that clears your quality bar beats the best model that exceeds it. Every point of intelligence above your bar is money spent on applause.
When Public LLM Benchmarks Stop Being Enough
Public numbers get you to a shortlist. They cannot get you to a signature, because no public test contains your formats, your domain language, or your edge cases. The models on your shortlist may also have seen every public question during training, which quietly inflates every score you compared.
The fix costs less than most teams expect. Collect 20 to 50 real examples from your workload with verified ground truth answers. Score your shortlist on them monthly. This tiny private set predicts your production outcome better than any famous leaderboard, and it doubles as a regression alarm when a vendor silently updates a model under you.
Score Your Model on Data It Has Never Seen
Building that private set well is the hard part. The questions need real expert judgment, clean labels, and zero overlap with anything crawlable. This is the work Humyn Labs does: evaluation datasets built by verified subject experts, kept out of training data by design, so a score on them can never be memorized. Public benchmarks tell you what the market thinks. A private eval tells you what your budget should do. If your next model decision carries real money, run it on questions the model has never seen. Talk to Humyn Labs about an evaluation set built from your actual workload.
FAQ
What are llm benchmarks and how do they work?
LLM benchmarks are standardized test sets that score language models on defined tasks such as reasoning, coding, and tool use. Each model answers the same questions, an automated grader scores the output, and the results become comparable numbers across models.
Which ai llm benchmark matters most for coding tasks?
Execution based tests matter most because the code must actually run. For an ai llm benchmark on coding, prioritize verified suites where a patch passes or fails real tests, then adjust the score by your per token cost to find the value pick.
How do I know if an LLM benchmark is saturated?
Check the spread at the top. When the leading models sit within 2 or 3 points of each other, the benchmark has stopped discriminating. Recent analysis found nearly half of the most cited benchmarks in this state, so always check before trusting a ranking.
Can I trust LLM leaderboards when choosing a model?
Trust them as a shortlisting tool, not a decision tool. Execution based leaderboards resist gaming. Preference arenas reward style over correctness. The reliable final step is a private evaluation on your own data, such as an expert built set from Humyn Labs, because it can never be memorized.
How do I calculate the real cost of an LLM for my business?
Divide your cost per attempt by the model’s success rate on your task family. That gives cost per solved task. Compare models on this number instead of raw accuracy, and pick the cheapest one that clears your quality bar.
Should small teams run their own LLM evaluations?
Yes, and the bar is low. A set of 20 to 50 real examples with verified answers, scored monthly, catches model regressions and vendor swaps that no public leaderboard will show you. Small teams arguably need this more because a wrong model choice hurts a small budget harder.
The Number Is Not the Decision
Back to that procurement call. The team did not lose because the leaderboard lied. They lost because nobody translated it. The score answered a question no one asked, and the question that mattered, what does a solved task cost us, never came up.
You now hold the translation layer. Match the family to the task. Check the spread. Divide cost by success. Then verify on data no model has seen. Do those four things and every llm benchmarks table you meet turns from a scoreboard into a purchasing tool. Your budget will notice the difference before your dashboard does.
